GMROI: The #1 Measure of Inventory Productivity
Gross Margin Return on Inventory Investment
by Patricia M. Johnson and Richard F. Outcalt 

Since 60% – 80% of a typical retailer’s total assets are in inventory, it is essential that retailers know how their inventory investment is performing. What is the "return on investment" of a retailer's largest investment? The GMROI calculation is the tool for the job!
Retailing…it’s like a huge maze. As an independent retailer, you have to get through all kinds of obstacles. Competition is incredibly tough. Credit is tight. And customers are fickle.
Getting through this maze – working smarter, not just harder – requires some creative approaches. To better navigate the maze, learn to use some key financial assessment tools; tools that provide quick feedback.
Retailers need key information fast, in retail time. One of the best tools for measuring and managing the productivity of your inventory investment is GMROI – Gross Margin Return on Inventory Investment. It's fast and easy to calculate. Best of all, it provides powerful insights specifically for retailers.
How to Calculate GMROI
GMROI – Gross Margin Return on Inventory Investment – indicates how much gross margin you get back for each dollar “invested” in inventory over a year. Through careful analysis, you can see which lines, departments or categories are the most rewarding for your inventory investment. And which are least productive!
Here’s the formula for calculating GMROI: (Use annual numbers; also, “Gross Margin” is sometimes called “Gross Profit”)
GMROI = Gross Margin $$ divided by Average Inventory @Cost
For example, consider this merchandise category with annual sales of $130,000 at a Gross Margin (or Gross Profit) of 49%
Gross Margin $$ = $63,700 • Average Inventory @Cost = $40,625
GMROI = $63,700 / $40,625 = $1.57
What does this mean?
In everyday language, it means that this retailer is getting back $1.57 in gross margin for every $1.00 invested in inventory in this category for the year.
This is a great tool! But, it becomes really powerful once you are able to compare this category to the others in your store, and/or to last year.
Get MORE about inventory control
The Power of GMROI: Compare and Contrast!
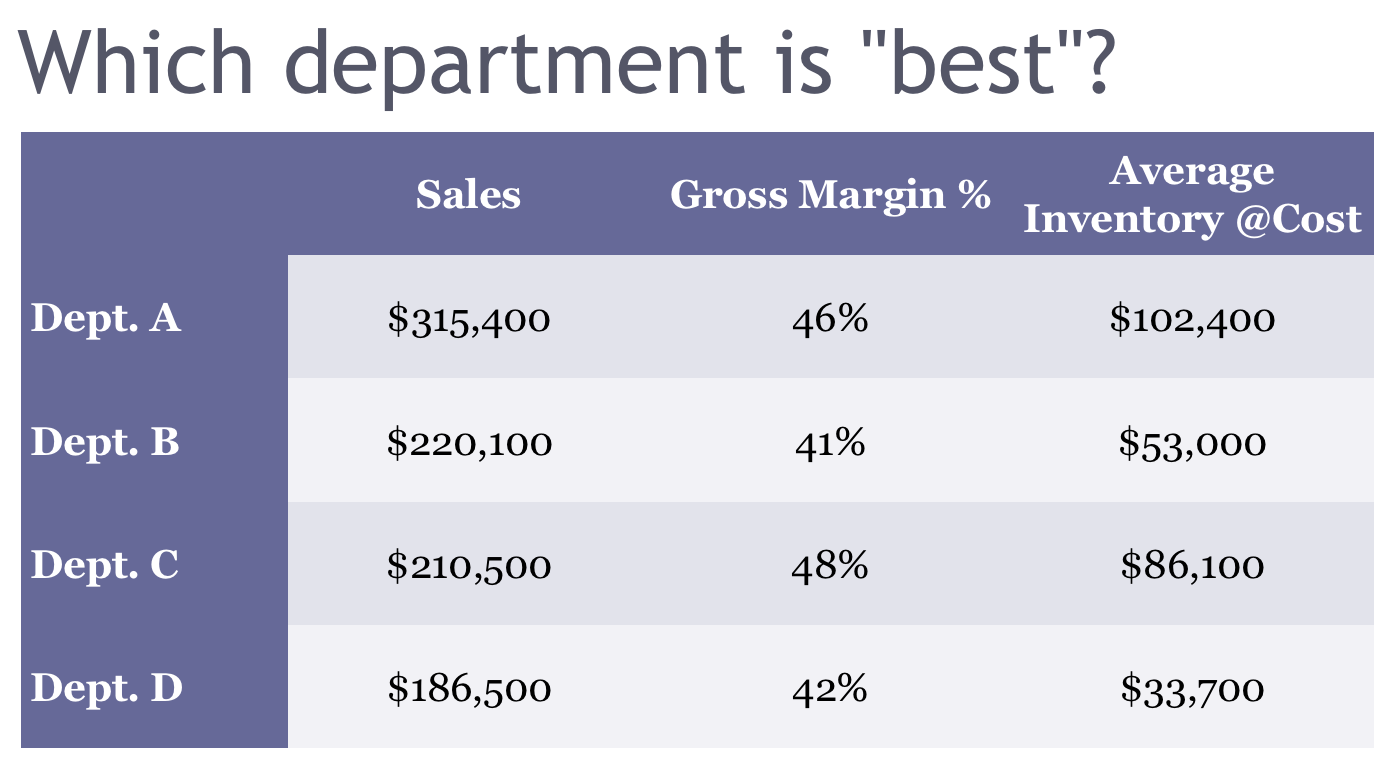
Consider this example. Which of these four departments is the most productive?

Well, let's see.
Department A has the highest sales (Gotta love a great top line!)
Departments B and C have similar sales.
But C has the highest margin.
So, we repeat: Which department is the "best" for this retailer?
Careful. That can be answered only after we calculate the GMROI.
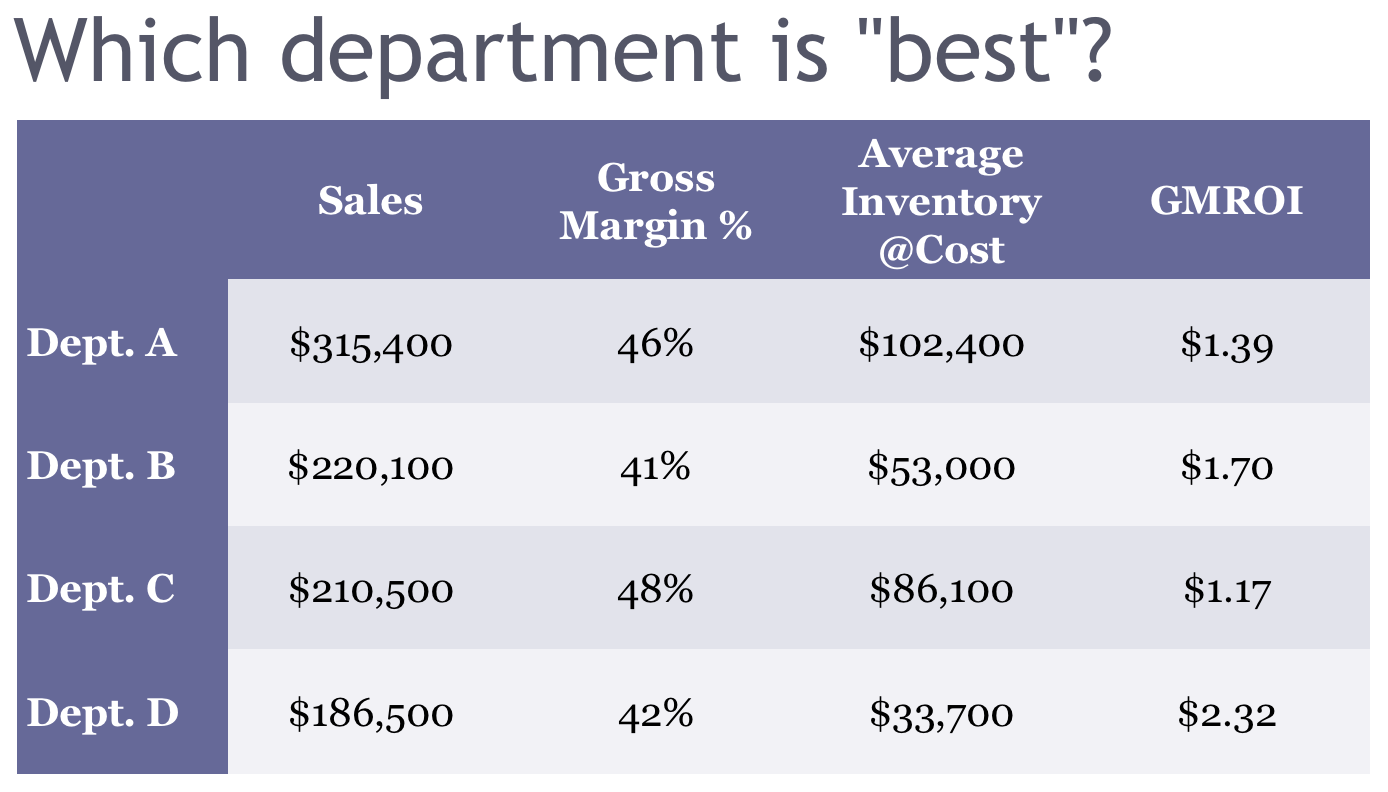
Here are the GMROI calculations for each of these four departments. Revealing, isn't it?

Department D – admit it, sometimes overlooked because it has the lowest sales and margin – is the productivity winner! It has the highest GMROI. Its lower margin is offset by its higher inventory turns.
One key takeaway to keep in mind: Sales and margin alone can’t really tell the whole story.
Prefer a "Down 'n Dirty" GMROI Formula?
Just find the Gross Margin Dollars (of a department) for one full week. Then multiply it by 52 weeks, and complete the calculation by dividing your current on-hand inventory at cost into the "annualized" figure for Gross Margin Dollars.
With many of today's POS systems, this is quick to calculate and useful for comparing departments on the fly.
Dynamic Management Tool for Retailers
You can calculate GMROI by departments, as above, or by categories, seasons, vendors, regions or individual stores.
The GMROI calculation provides good insights into the productivity of your inventory investment. You will find a new awareness when each product line is weighed in terms of combined gross margin profitability and turnover.
GMROI is a powerful tool for retailers. It allows you to examine and analyze results to date, as well as playing “what if…?” with future plans.
GMROI analysis may challenge your notion of which products you should carry, or even which vendors you should buy from. A GMROI well below the others should be challenged. Ask questions like these:
-
“Do I devote too much inventory to this category?”
-
“Could my vendor ship me more frequently?”
-
“Is that ‘special buy’ really a wise investment, given how much I have to buy upfront?”
-
“How much can I cut prices to increase sales without lowering my GMROI in that category?”
The merchandise retailers are selling hasn’t changed much over the years. Sure, there are fads and technological advances. But retailers must still sell to meet customer needs and desires.
This makes it essential that every dollar invested in inventory be as productive as possible at producing gross margin dollars. The GMROI calculation helps retailers quickly see where to get more bang for the buck.
©Copyright, The Retail Owners Institute® and Outcalt & Johnson: Retail Strategists, LLC.